For serious prop traders

Your true ROI,
finally measured.

Prop firms show you gross. Proplytics shows you net. Log every challenge fee, reset, activation and payout across all your firms, and see what you actually made.

$4.99/mo or $44.99/yr, cancel anytime
Example ledger, all firms 4 firms
+$4,410
Net profit+203% ROI
Total spent
−$2,172
Total payouts
$6,582
True ROI
+203%
What the firms showed you: +$6,582 gross
Built for traders on FTMO The Funded Trader MyForexFunds E8 Markets The5%ers FundedNext
The gross-number trap

The payout screen lies by omission.

Firms love to show you the money that hit your account. They quietly forget the four challenge fees, two resets and an activation it took to get there. Net is the only number that pays your rent.

What the firm shows
+$6,582
Gross payouts. The fees never appear on this screen.
Payouts banked+$6,582
Fees mentioned$0
versus
What Proplytics shows
+$4,410
Every fee subtracted from every payout.
Payouts banked+$6,582
Challenge fees−$1,372
Resets & activations−$800
Real ROI+203%
What it does

Every cost, counted.

Four things to log, one number that matters. Proplytics does the accounting prop firms hope you never do.

Log every expense

Challenge fees, resets, activations, payouts. Tag the firm, the account size and the phase in two taps.

True net P/L

Real profit after every fee, recalculated the instant you log anything.

All firms, one view

FTMO, Funded Trader, MyForexFunds and the rest, aggregated into one figure with a per-firm ledger behind it.

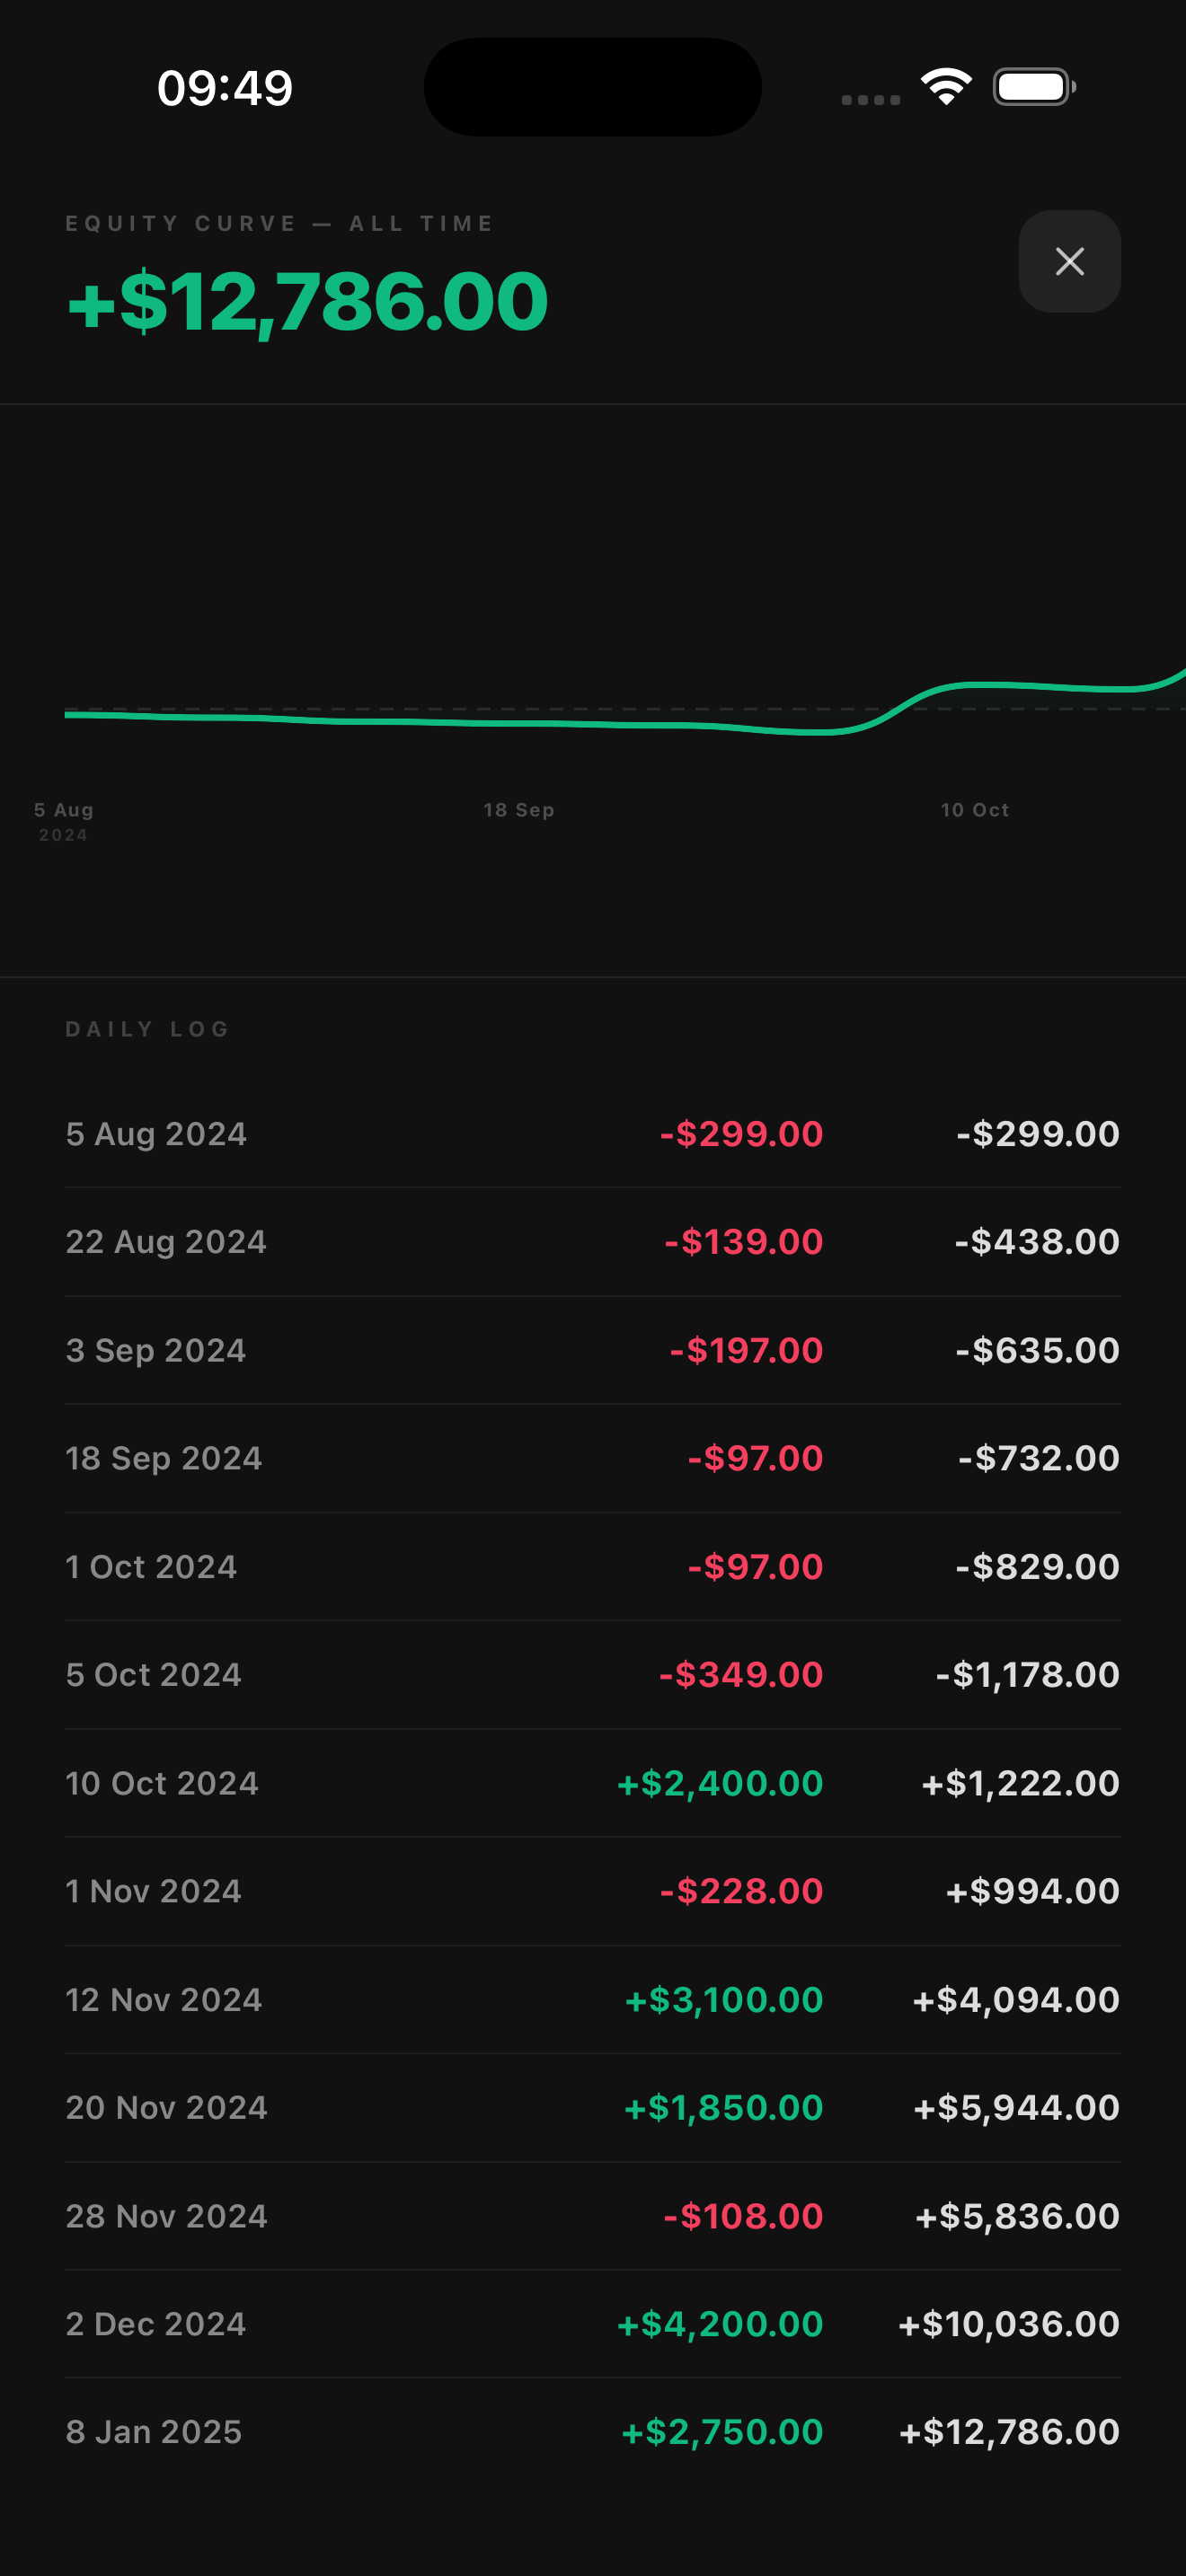
Cumulative equity curve

Watch your real balance climb out of the fee hole across every firm. A running daily ledger shows exactly when you crossed into profit and what it cost to get there. Win rate, average cost per challenge and ROI on spend are calculated from the entries you logged.

Private by default

Your numbers stay on your phone. Proplytics works without a brokerage login, and your ledger is never sold or shared.

15 seconds inside the app

This is the whole thing.

Your true net P/L sits at the top in green you can't argue with. Total spent, total payouts and real ROI sit underneath, with every firm rolled into a single figure.

  • Net P/L updates the moment you log a fee or payout
  • Recent activity stream, with fees in red and payouts in green
  • Filter by firm while keeping the aggregate in view
Analytics

Proof of whether the funding chase pays.

The cumulative equity curve doesn't flatter you. It shows the climb out of the fee hole, the day you crossed zero, and your real return on every dollar spent chasing funding.

  • All-time equity curve with a running daily log
  • Cumulative ROI, win rate and average cost per challenge
  • Firm allocation, so you can see where the money actually goes
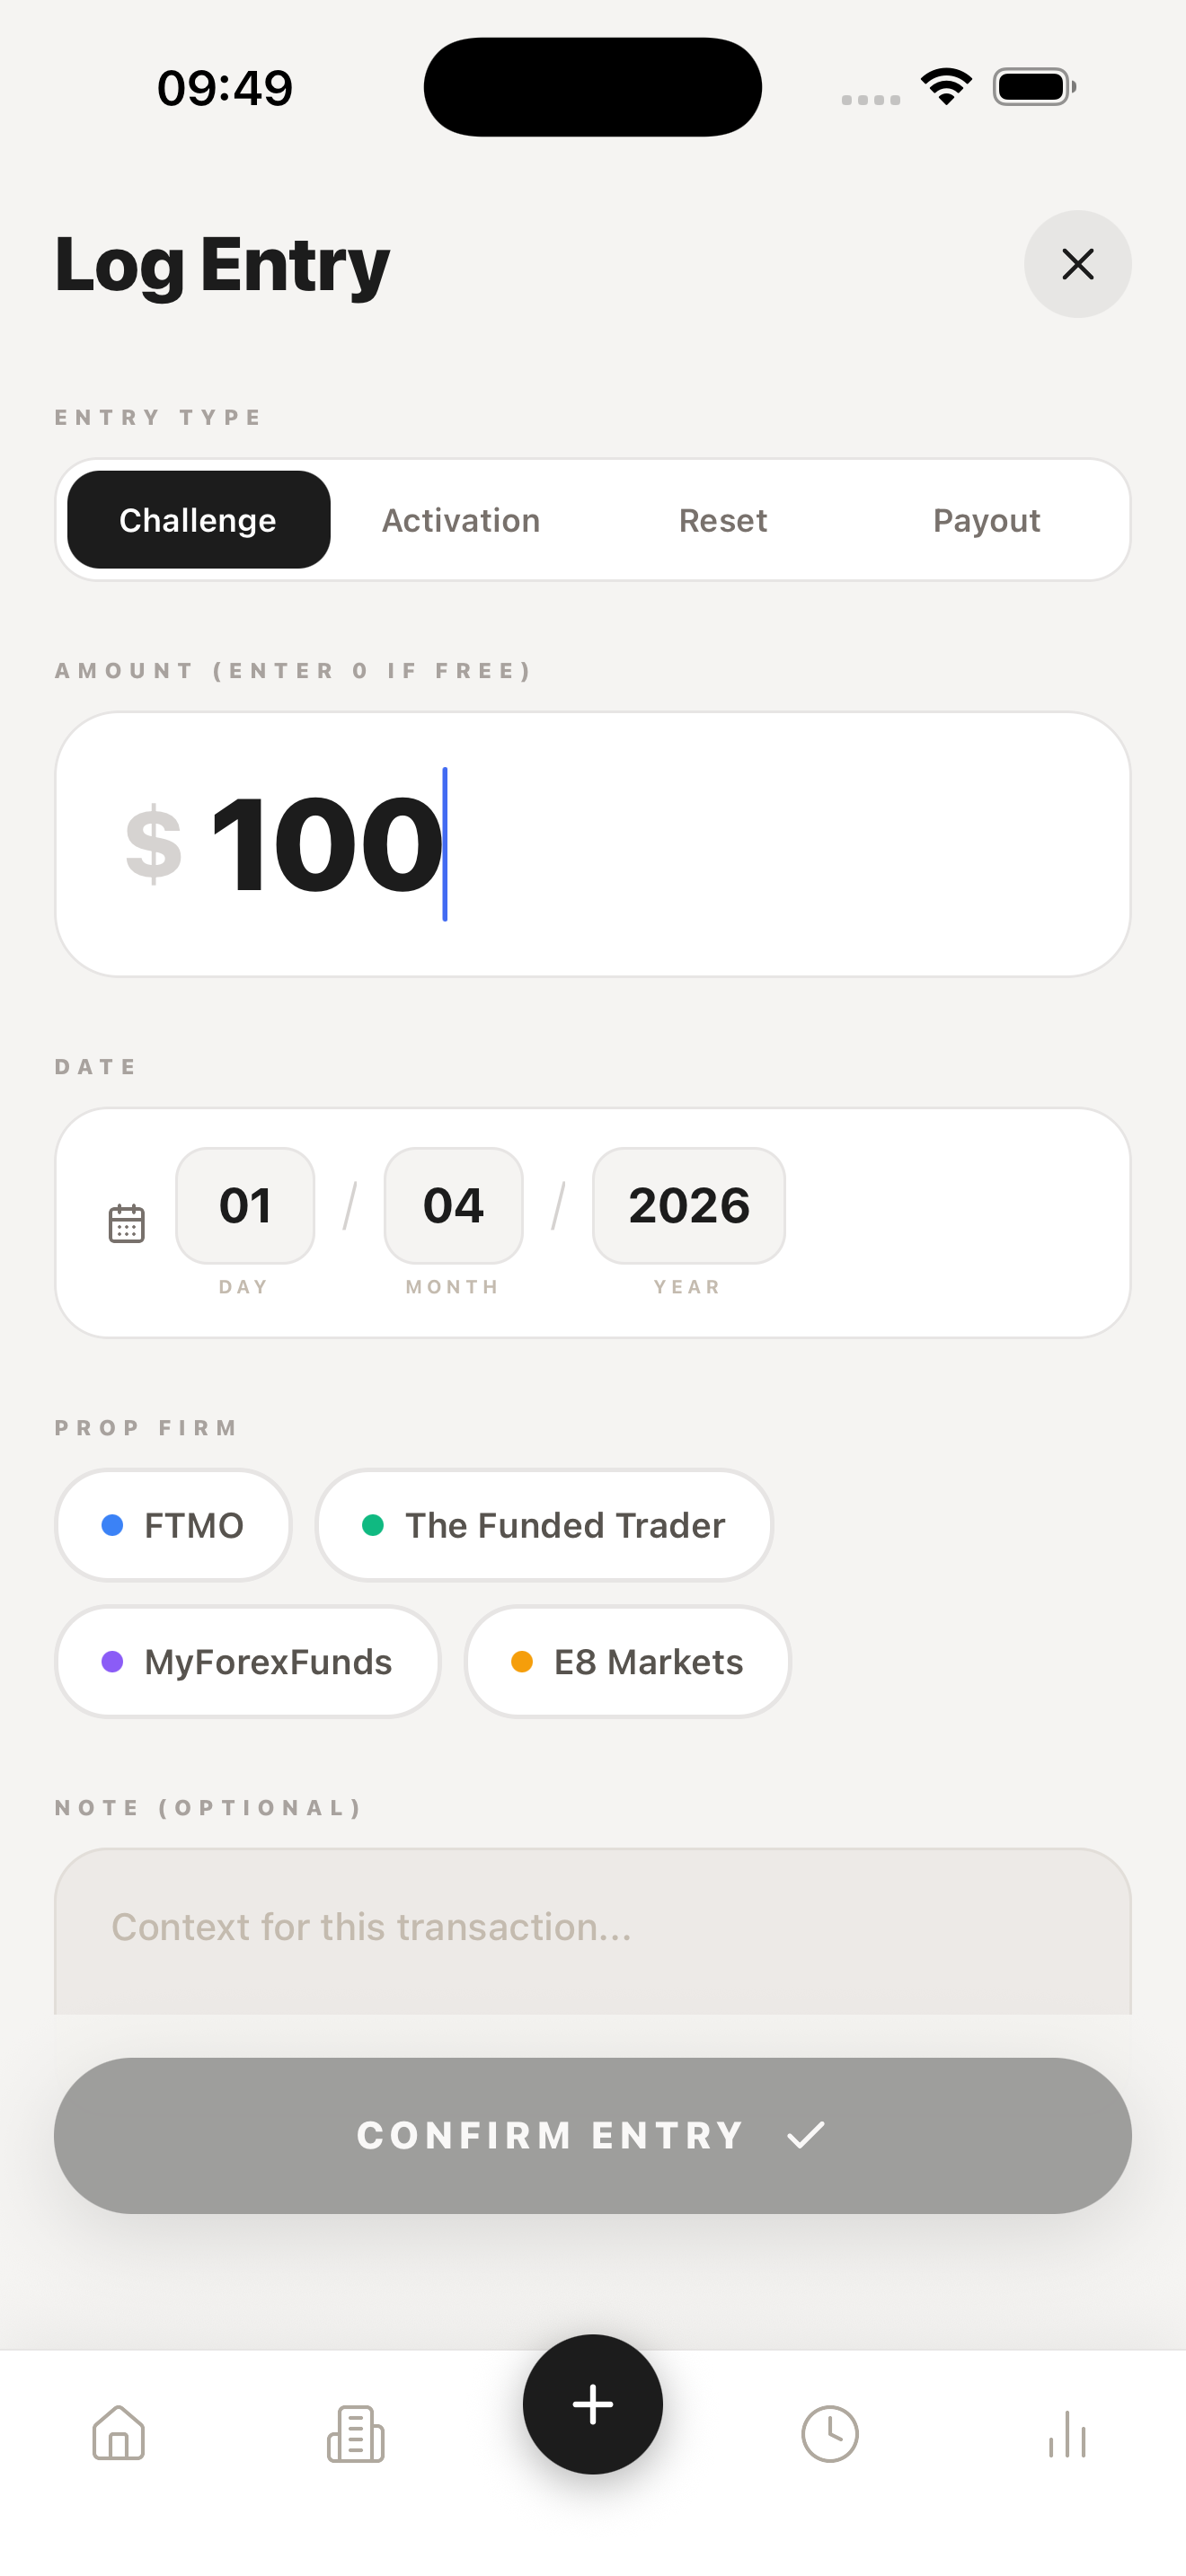
Proplytics log entry screen
Proplytics all-time equity curve and daily log
Pricing

Less than one reset fee. Per year.

One simple subscription. Pay monthly or save 25% with yearly. Cancel in a tap from the App Store.

Monthly
$4.99/month
Billed monthly, cancel anytime
  • True net P/L across unlimited firms
  • Equity curve, ROI & full analytics
  • All future updates included
Get monthly
Yearly SAVE 25%
$44.99/year
Billed yearly, which works out at $3.75/mo
  • True net P/L across unlimited firms
  • Equity curve, ROI & full analytics
  • Per-firm ledgers & activity history
  • All future updates included
Get yearly

$44.99/year works out at $3.75/mo, a 25% discount on the monthly plan.

Questions

Common questions.

Run the numbers
on your own trading.

Download Proplytics and put a real figure on what the funding chase has paid you so far.